
95628 Sold Listings (27) is 57% of its Oct Avg of 47 (ranked 11 of 52)
Composite Average favors Buyers — Sold Listings % of its Oct Avg is less than 100% (66%)
95628 SoldOct Avg 47SFRs
Showing Fair Oaks 95628 · Sacramento County
Fair Oaks 95628 · October 2026
vs Sep 2026
vs Oct 2025
$515,000
$639,400
-$124,400
42
27
$38,200,000
Composite Average
0 S · 6 B · 0 N
Sellers / Buyers / Neutral
Sacramento County
0 S · 6 B · 0 N
Sellers / Buyers / Neutral
Fair Oaks 95628
1 S · 5 B · 0 N
Sellers / Buyers / Neutral
Median and 12-MMA are not in this tally. These six are the current month: Divergence, Volume, Canc, Sold, Offers, and CDOM. Lean Score™ is historical and is not counted. Not a forecast and not a decision.
| Metric | ||||||||
|---|---|---|---|---|---|---|---|---|
| 95628 VALUE | $515,000 | $639,400 | -124,400 (▼-2) | $38,200,000 | 14 | 27 | 70 | 42 |
| $588,000 | $591,700 | -3,700 (▼) | $28,200,000 | 13 | 23 | 44 | 47 | |
| — | — | BUYERS | BUYERS | SELLERS | BUYERS | BUYERS | BUYERS | |
| — | — | pos = SELLERS · 0 = NEUTRAL · neg = BUYERS | pos MoM% = SELLERS · 0 = NEUTRAL · neg MoM% = BUYERS | > 12-yr same-month avg = BUYERS · equal = NEUTRAL · < = SELLERS | > 12-yr same-month avg = SELLERS · equal = NEUTRAL · < = BUYERS | > 12-yr same-month avg = SELLERS · equal = NEUTRAL · < = BUYERS | > 12-yr same-month avg = BUYERS · equal = NEUTRAL · < = SELLERS | |
| Rank of 52 zips | 28 of 52 | 18 of 52 | 52 of 52 | 10 of 52 | 15 of 52 | 11 of 52 | 6 of 52 | 23 of 52 |
| 12-yr same month | — | — | $7,158 | $49,628,880 | 20 | 47 | 95 | 41 |
| Lows / Highs | YoY 12-yr Oct low | 12-yr Oct high | 12-yr Oct low | — | — | — | — | — |
| Market Summary | Fair Oaks 95628. Median $515,000. 12-MMA $639,400. Divergence -124,400 (▼-2). CDOM 42. Sold 27. Volume $38,200,000. Shows 1 metric favoring Sellers, 5 favoring Buyers, and 0 Neutral. Median is below its 12-MMA. 2 lows, 1 high on the 12-yr October match. Median and 12-MMA are not in the tally (1 Sellers / 5 Buyers / 0 Neutral). Lean Score™ -5.8 is the historical measure and leans toward Buyers. It is not in the current-month tally. Parts: Divergence -4.93, Volume -0.26, Canc 0.33, Sold -0.73, Offers -0.25, CDOM 0.07. | |||||||
Month-matching-month: this October versus the prior 12 Octobers (2014–2025). Oct Avg is the mean of those 12 Octobers, not a 12-month moving average. A 12-yr Oct low or high is the current print in that window.
12-yr Oct lows
12-yr Oct highs
Composite Average favors Buyers — Sold Listings % of its Oct Avg is less than 100% (66%)
Composite Average favors Buyers — Canc Listings % of its Oct Avg is greater than 100% (112%)
Fair Oaks 95628 · 8 years. Dollars on the left. Þ on the right (zero = no force).
Highest Median Price is $1,315,000 in Granite Bay 95746
Lowest Median Price is $355,000 in Fruitridge 95824
Composite Average Median Price is $588,000
Highest Median Price 12-MMA is $1,272,700 in Granite Bay 95746
Lowest Median Price 12-MMA is $354,900 in Arden 95815
Composite Average Median Price 12-MMA is $591,700
Highest Median Price Momentum is 7.8 in Loomis 95650
Lowest Median Price Momentum is -14.4 in West Sac 95605
Composite Average Median Price Momentum is -0.4.
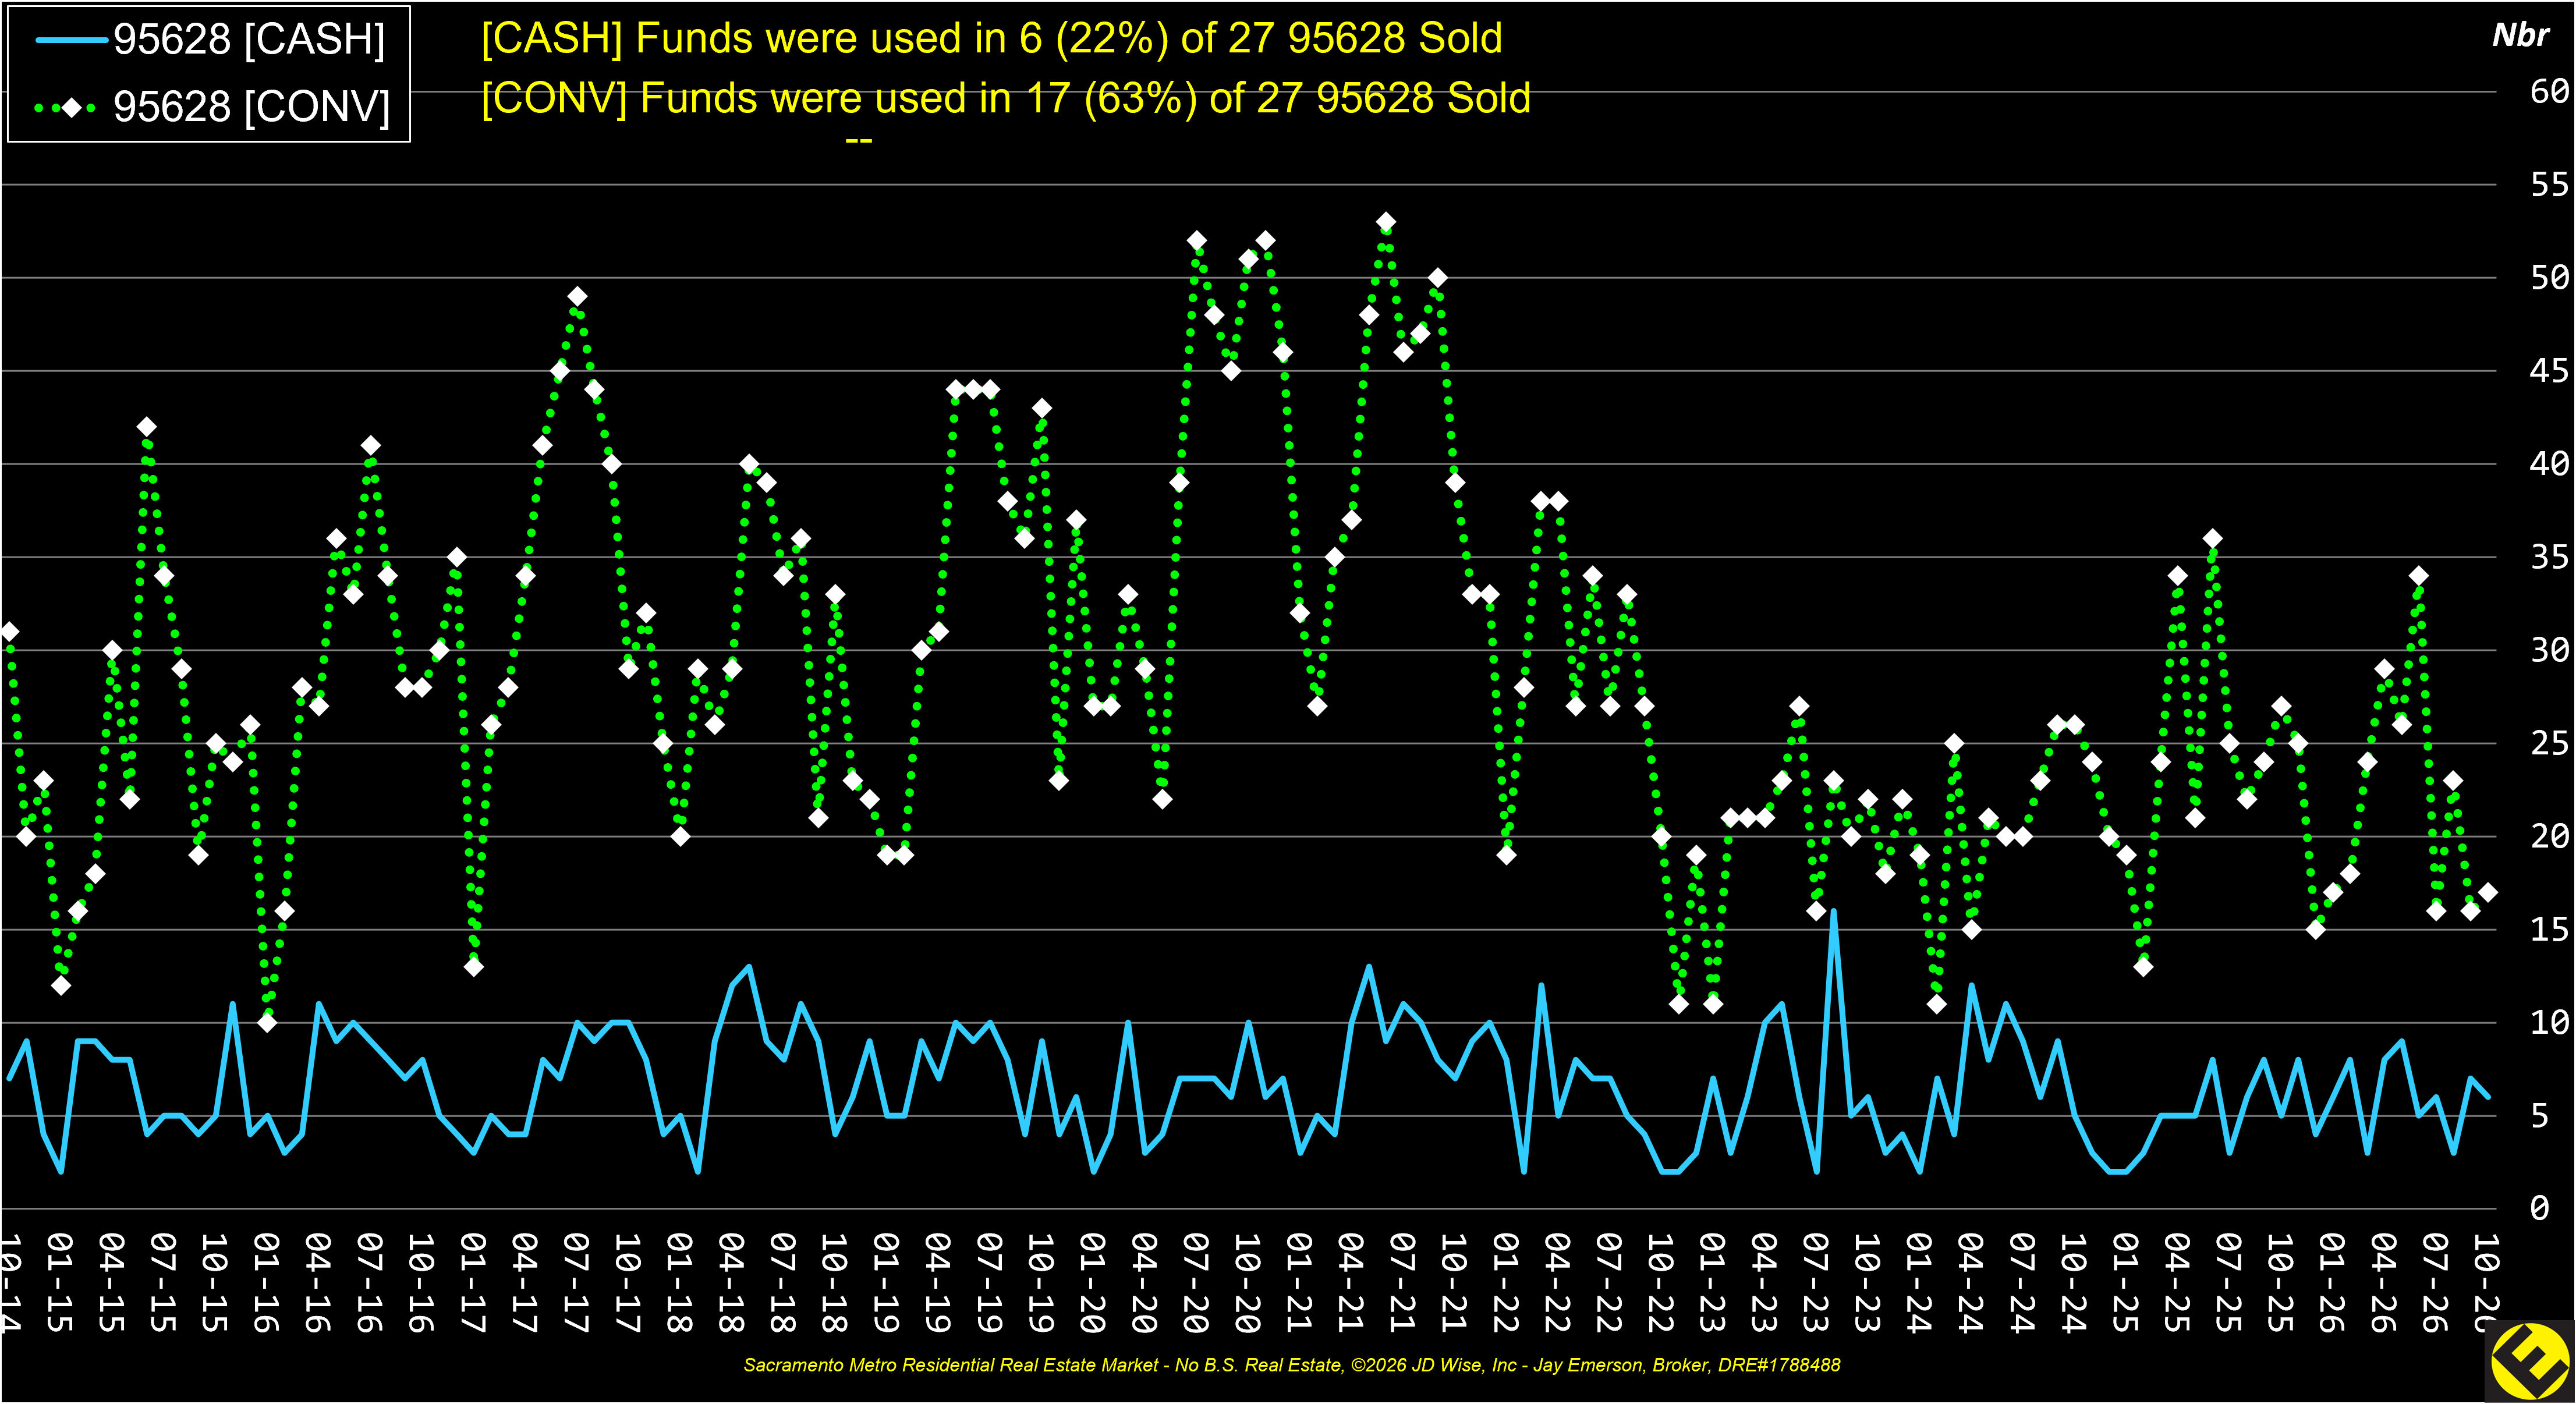
Fair Oaks 95628. Cash and conventional counts on closed sales, October 2014–October 2026. The last five years show the price-elasticity shift. October 2026: cash 6 (22%) of 27 sold. Conventional 17 (63%).
Fair Oaks 95628. February 1997 – September 2026. The long bar is that column’s window. The short bar is 13 years, where the sheet has one. The gold mark is this month. The tick in the middle of the bar is the average. Not a forecast.
—
on record
No number this month. In on record, the low is 1, September 2005, May 2006, and December 2006, and 34 more. The high is 24, August 2008.
—
on record
No number this month. In on record, the low is 1, August 2007, November 2007, and December 2007, and 30 more. The high is 22, May 2012 and December 2012.
—
23 yr
13 yr
No number this month. In 23 yr, the low is 19, March 2023. The high is 283, September 2006.
—
23 yr
13 yr
No number this month. In 23 yr, the low is 15, December 2008. The high is 116, August 2005.
—
23 yr
13 yr
No number this month. In 23 yr, the low is 5, November 2008 and February 2009. The high is 73, July 2017 and October 2020.
—
23 yr
13 yr
No number this month. In 23 yr, the low is 5, February 2009. The high is 78, October 2020.
—
15 yr
No number this month. In 15 yr, the low is 2, February 2022 and April 2022. The high is 36, October 2016.
—
26 yr
13 yr
No number this month. In 26 yr, the low is 5, November 2008 and February 2009. The high is 248, October 2020.
—
30 yr
13 yr
No number this month. In 30 yr, the low is $141,250, September 1997. The high is $725,000, February 2026.
—
30 yr
13 yr
No number this month. In 30 yr, the low is $158,600, November 1997. The high is $665,200, June 2026.
—
29 yr
13 yr
No number this month. In 29 yr, the low is -$86,300, November 2022. The high is $97,600, April 2020.
—
30 yr
13 yr
No number this month. In 30 yr, the low is -24.1, June 2009. The high is 26.9, June 2004.
—
23 yr
13 yr
No number this month. In 23 yr, the low is 10 days, May 2022. The high is 194 days, February 2008.
—
13 yr
No number this month. In 13 yr, the low is 1.0, January 2014, February 2014, and March 2014, and 27 more. The high is 8.1, February 2024.
—
13 yr
No number this month. In 13 yr, the low is 15%, April 2021 and February 2024. The high is 100%, January 2014, February 2014, and March 2014, and 27 more.
—
13 yr
No number this month. In 13 yr, the low is $8,039,900, January 2015. The high is $151,235,486, April 2021.
—
10 yr
No number this month. In 10 yr, the low is $3,124,000, November 2018. The high is $119,477,450, April 2021.
—
10 yr
No number this month. In 10 yr, the low is $10,157,400, January 2017. The high is $43,948,800, May 2021.
—
13 yr
No number this month. In 13 yr, the low is 1, February 2014 and August 2014. The high is 16, August 2023.
—
13 yr
No number this month. In 13 yr, the low is 10, January 2016. The high is 53, June 2021.
—
13 yr
No number this month. In 13 yr, the low is 1, October 2018, March 2019, and April 2020, and 14 more. The high is 15, May 2015 and July 2015.
—
13 yr
No number this month. In 13 yr, the low is 1, February 2014, October 2014, and November 2014, and 33 more. The high is 8, August 2015 and October 2019.
—
13 yr
No number this month. In 13 yr, the low is 1, February 2014, March 2014, and April 2014, and 52 more. The high is 4, September 2014, September 2015, and December 2024.
—
22 yr
13 yr
No number this month. In 22 yr, the low is -58%, May 2023. The high is 121%, February 2025.
—
22 yr
13 yr
No number this month. In 22 yr, the low is -62%, April 2008 and November 2008. The high is 128%, November 2009.
—
22 yr
13 yr
No number this month. In 22 yr, the low is -72%, November 2008. The high is 417%, December 2011.
—
22 yr
13 yr
No number this month. In 22 yr, the low is -66%, December 2007. The high is 230%, September 2012.
—
14 yr
No number this month. In 14 yr, the low is -75%, April 2022. The high is 325%, June 2025.
—
22 yr
13 yr
No number this month. In 22 yr, the low is -79%, November 2022. The high is 417%, December 2011.
—
29 yr
13 yr
No positive run this month. The longest in 29 yr is 20, December 2004.
—
29 yr
13 yr
No negative run this month. The longest in 29 yr is 9 months, July 2009.
One chart per stance metric for this geography. Hover a point for the value.
Highest Median Price Divergence™ is 222,000 in Loomis 95650
Lowest Median Price Divergence™ is -124,400 in Fair Oaks 95628
Composite Average Median Price Divergence™ is -3,700.
Highest Median Price Momentum is 7.8 in Loomis 95650
Lowest Median Price Momentum is -14.4 in West Sac 95605
Composite Average Median Price Momentum is -0.4.
in Sacramento County
(37 Sacramento County zipcodes). Tap a bar to open that geography.
Highest Median Price is $1,315,000 in Granite Bay 95746
Lowest Median Price is $355,000 in Fruitridge 95824
Composite Average Median Price is $588,000
Highest Median Price 12-MMA is $1,272,700 in Granite Bay 95746
Lowest Median Price 12-MMA is $354,900 in Arden 95815
Composite Average Median Price 12-MMA is $591,700
Highest Median Price Divergence™ is 222,000 in Loomis 95650
Lowest Median Price Divergence™ is -124,400 in Fair Oaks 95628
Composite Average Median Price Divergence™ is -3,700.
Price momentum (Þ) across 52 zip codes · 10-26
44% of zips
56% of zips
positive Þ
23 up / 29 down
buyer
max 95650 · min 95605
Monthly tally of zip codes — Up, Down, No Change. Not an average. 8 years.
10-26: 23 Up (28 last month, 21 last year). 29 Down (19 last month, 29 last year). 0 NC. Swing 6 (23 Up, 29 Down). 52 zips tracked.
Last Up high 48 (05-21). Last Up low 1 (08-06). Last Down high 48 (12-22). Last Down low 4 (05-21).
Zip codes with positive median Þ (Þ > 0) vs the 52-zip average median. Positive Þ favors Sellers. 8 years.
Average median $588,000, 0.2% MoM, 0.2% YoY, peaked 05-22. 21 zips in the Buy Zone (Þ > 0).
Last Buy Zone high 52 (10-22). Last Buy Zone low 0 (02-10).
Macro inputs used alongside local MLS composites. Tap a navy term? for the definition. Each series has its own chart.
7.33%
10-26
81.9
09-26 · last month
48.0
10-26
29
10-26
552
08-26 · 2 months ago
1,106.0k
09-26 · last month
840.0k
09-26 · last month
266.0k
09-26 · last month
918
08-26 · 2 months ago
83,719
08-26 · 2 months ago
28
08-26 · 2 months ago
-10k
07-26 · 3 months ago
−132.3% MoM · −113.9% YoY
13k
07-26 · 3 months ago
+150.0% MoM · +1400.0% YoY
1 rows · Sellers, Buyers, and Neutral are the favoring tallies (Median and 12-MMA are not counted) · tap a header to sort · tap a row to open its geography report
| 95628 | Fair Oaks 95628 | SA | 1 | 5 | 0 | $515,000 | $639k | 2.4 | |||||
| Subtotal | 1 | 5 | 0 | ||||||||||
Hover or tap a navy-highlighted term (dashed yellow underline + yellow “?”) for the definition. Terms are part of the published app. Additions, edits, and deletes are made in Build Mode, not on this page.
Metrolist (distressed sales excluded from housing composites). Figures compiled from Metrolist for Sacramento, Placer, and El Dorado counties (52 tracked zip codes). Not a prediction and not legal advice. Jay Emerson, Broker, Emerson Real Estate — Cal DRE# 01788488.